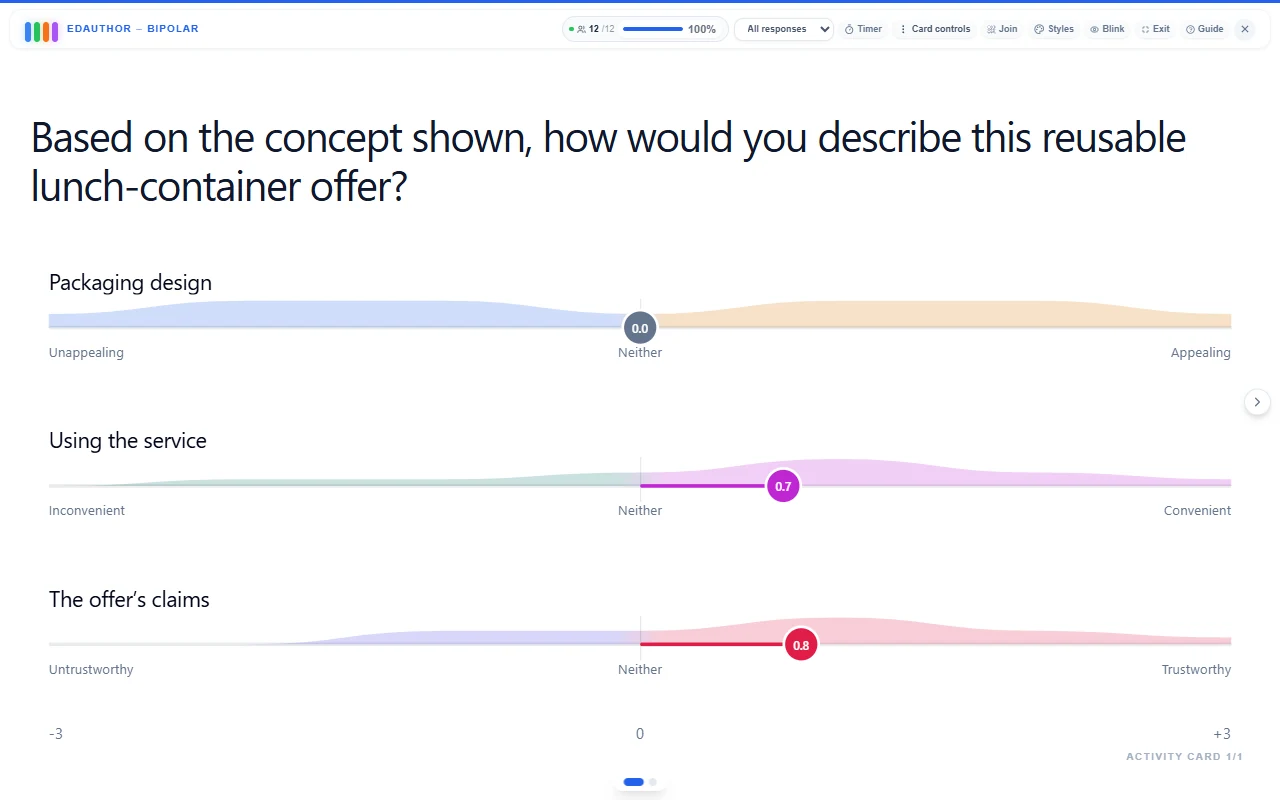
Opposite meanings, visible responses
Bipolar is edauthor’s dedicated Activity Card for collecting positions between two opposing descriptions. Use it for semantic differential scales, such as Unappealing to Appealing, with a labelled centre and a symmetric negative-to-positive range. Participants rate up to eight items individually. Live results show the average and response distribution. You can compare existing groups or use non-anonymous answers to one selected item to create two groups for a follow-up activity.
For lecturers, consumer researchers, trainers and workshop facilitators, the useful question is what comes after the rating. Which features shaped the response? Where do perceptions differ? What evidence would change someone’s judgement?
Semantic differential scales and Likert-style ratings
A semantic differential asks someone to position an object, experience or concept between contrasting descriptions. For a product concept, you might ask participants to rate its appearance between Unappealing and Appealing, or its instructions between Confusing and Clear. The pair should describe opposite ends of the same dimension.
A Likert-type item usually asks for agreement with a statement, such as “The instructions are easy to follow”, using an ordered disagreement-to-agreement response range. Several related items may form a Likert scale when there is a defensible basis for combining them. The Scale guide explains that distinction and gives a consumer-behaviour example. Sullivan and Artino’s research guide discusses the interpretation of Likert-type responses.
edauthor gives these approaches separate cards and controls:
| Card | Response design | A useful application |
|---|---|---|
| Scale | Shared lower and higher values with endpoint labels | Agreement with several statements, confidence or usefulness ratings |
| Bipolar | Symmetric range around zero, with left, centre and right labels; labels can differ by item | Product impressions, brand perceptions and experience profiles using opposite descriptors |
Bipolar’s handle begins in the centre. A coloured fill extends towards the chosen side, with the value shown alongside the item. This makes direction and strength visible. The negative sign means the left-hand side, not necessarily a bad result: Traditional to Modern describes a positioning dimension, not a universal quality ranking.
Applications beyond the classroom
A few carefully chosen pairs can give a workshop a useful perception profile. These are suggested starting points, not validated questionnaires.
| Context | Possible descriptor pair | A follow-up question |
|---|---|---|
| Consumer behaviour and packaging | Unappealing / Appealing | Which design detail influenced your impression? |
| Brand positioning | Traditional / Modern | What signals made the brand feel that way? |
| Website or service design | Confusing / Clear | Which step needs a clearer explanation? |
| Product or service experience | Inconvenient / Convenient | Where does the experience create effort? |
| Communication and advertising | Unconvincing / Convincing | Which claim needs stronger evidence? |
| Teaching and professional development | Unclear / Clear | Which part should we revisit with an example? |
Present a common stimulus first, such as the same packaging image, service description or short demonstration. Keep the question specific to that stimulus. An impression of a picture does not establish how the product performs in use.
Semantic differential methods also appear in contemporary research beyond marketing. For example, Shang, Hsieh and Shah (2024) developed and evaluated a semantic differential instrument for trust in AI agents. That illustrates the breadth of the method; the short activities here do not reproduce or validate their instrument.
For audiences in different countries, check that translated descriptor pairs retain the intended opposition. Ask a few people from the intended audience to explain the wording before collecting responses. Keep product names, stimulus details and instructions consistent when comparing collections.
A supermarket study could compare impressions such as Dull to Exciting or Unpleasant to Pleasant. A pair such as Traditional to Modern instead describes positioning, and should not automatically be added to an overall favourability score. Choose dimensions deliberately and keep their interpretation clear.
Build your first Bipolar card
- Add the activity. In the Activity Cards editor, select Add Activity, then Bipolar. Add a title and a Question / Prompt.
- Set the Response range. Enter an Endpoint value from 1 to 20. This creates matching endpoints around zero. A value of 3 gives seven selectable positions: −3, −2, −1, 0, 1, 2 and 3. The default is 10, giving a range from −10 to +10.
- Choose the Label system. Shared labels uses the same left, centre and right descriptions for all items. Individual labels lets each item have its own pair and centre description.
- Write the Items. Use Add bipolar item, up to eight items. Each item prompt supports up to 250 characters. You can reorder items, delete them while retaining at least one, or paste a list with one item per line.
- Set the labels. For Individual labels, complete Left label, Centre label and Right label under each item. For Shared labels, use the three shared fields above the item list. Explain what the centre means in your activity.
- Choose skipping and visibility. Allow participants to skip individual bipolar items is on by default. Show responses live controls whether incoming responses appear straight away. Anonymous hides individual attribution; leave both card and session anonymity off if you intend to create groups from answers.
- Preview and save. Check each pair, centre meaning and range, then save your Activity Cards and include the card in your session. Put any explanation of the stimulus or response numbers in Additional Instructions (optional).
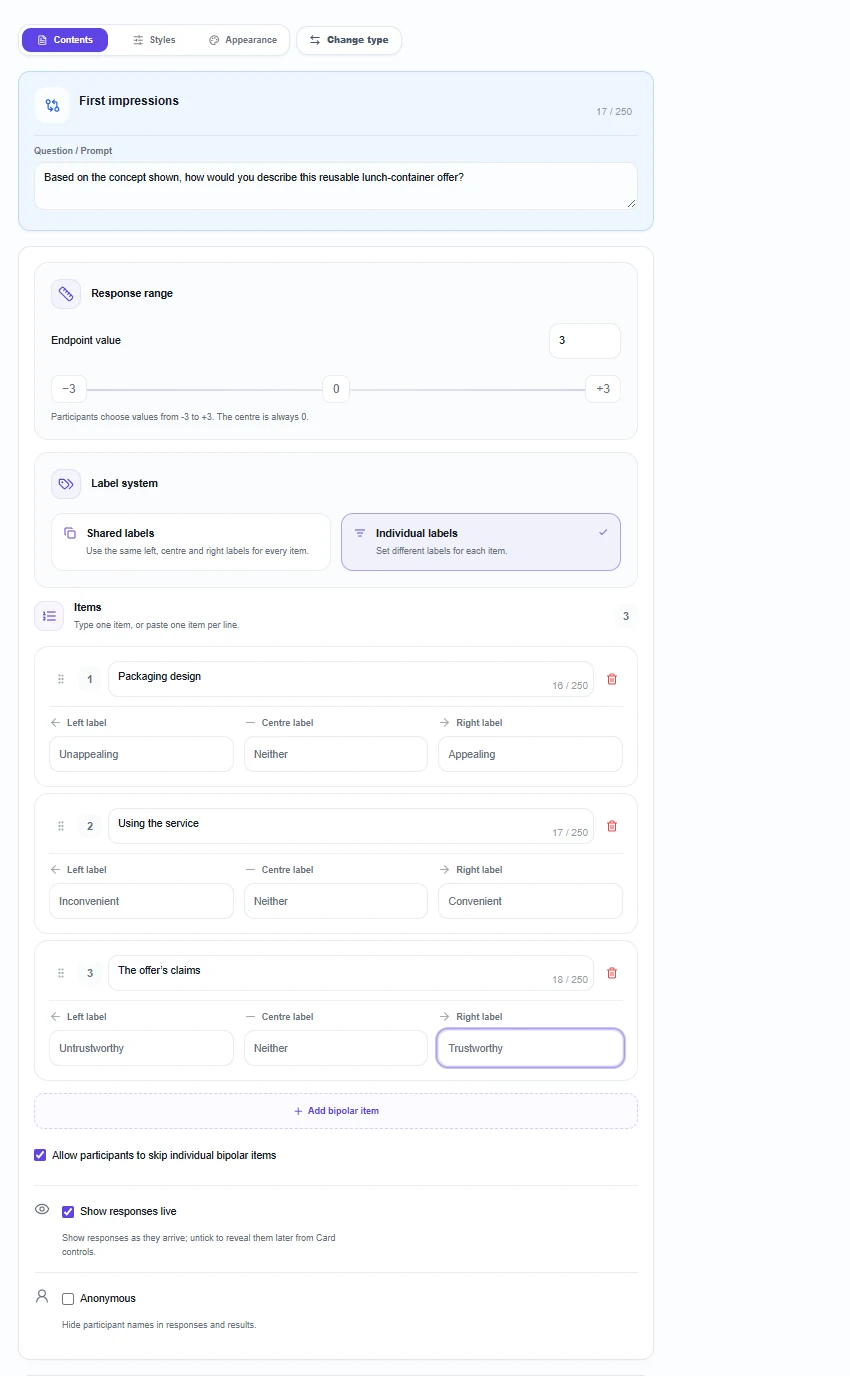
Use Shared labels when the same dimension applies to several objects, such as rating three packaging concepts from Unappealing to Appealing. Use Individual labels when you want several dimensions for one object. Keep each item and its two poles about one thing: Cheap and Sustainable are not opposites, since a product could be both.
What participants see and submit
Participants can join using the session’s QR code, link or code without an edauthor account. When the card is active and accepting responses, they move each slider towards the description that best fits their view, then select Submit once.
Sliders start at zero, and unchanged zeroes can be submitted. Ask participants to review every item. A centre response counts as a numeric rating. If they lack the information needed to answer, Skip is the separate option when enabled; it contributes no value to that item’s average or distribution. Participants can skip all items.
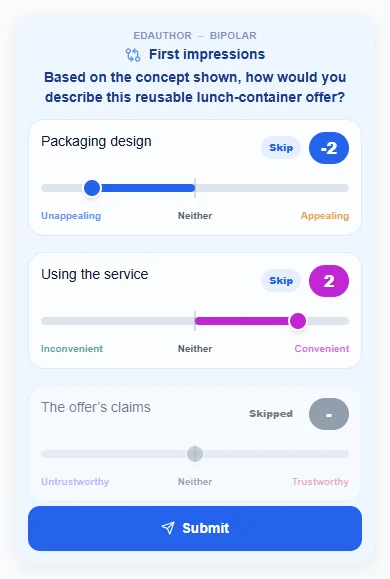
Define the centre carefully. “Neither” can mean neither pole describes the impression, while a middle position can also reflect mixed feelings. Ask a follow-up if that distinction matters. Do not treat zero automatically as “I do not know”.
Submissions remain individual when participants belong to groups. You can ask people to discuss first and then each submit, but the displayed group average is not a collective or unanimous answer.
Read the profile and the spread
The results place each item on the same centred axis. The average marker shows the arithmetic mean of its submitted numeric ratings to one decimal place. The shaded distribution shows where those ratings lie, with different colours on the two sides. Hover over a row to reveal counts at the selected values.
A mean near zero can arise from responses clustered at the centre or from opposing views that cancel numerically. In the packaging example, five ratings lie to the left, five to the right and one at zero; another participant skipped that item. Its mean of 0.0 therefore opens a conversation about differing perceptions.

Distribution height is normalised within each row. Use counts, rather than peak heights across rows, to compare numbers of responses. Skipping means the number of ratings can differ between items. Neither a mean nor a smooth-looking distribution establishes statistical significance.
For independent first impressions, untick Show responses live and reveal the results later from Card controls. Keep the wording, range and stimulus unchanged during a collection.
Create groups from Bipolar responses
This is a useful connection between measurement and facilitation. Choose one item and let participants’ positions on either side of its centre create two working groups. You might ask each group to explain what shaped its impression, then exchange suggestions.
- Collect non-anonymous individual responses in the owning host’s live main room. Session anonymity must also be off. If the session is already split, use Un-split groups before starting a new split from results.
- Open Card controls, then Use card results. The Create groups from answers preview appears.
- Select the Bipolar item that should determine membership. This uses one item, not a combined score across the card.
- Choose letters or numbers under Group names. Check the two proposed groups, their sizes and the unassigned count.
- Select Create groups. The current activity stays open and its responses remain recorded. Continue to a separate follow-up card with the new groups.
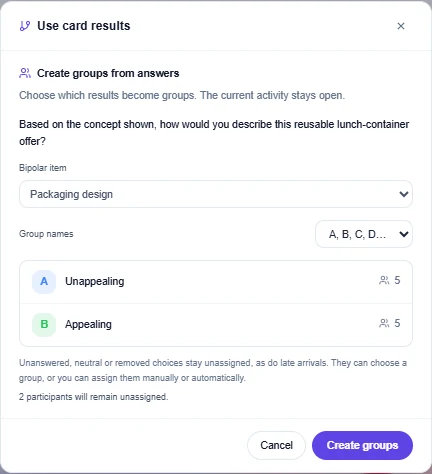
Negative values go to the left-label group; positive values go to the right-label group. Zeroes, skipped items and unanswered items remain unassigned, as do late arrivals. They can choose a group or you can assign them through the host controls. The split does not balance the two sizes and does not create a third neutral group.
Explain the purpose of grouping before collecting answers. These are temporary discussion groups based on a particular response, not fixed categories of people. Allow room for mixed views and for someone to say that their rating reflected a different interpretation of the question.
Compare responses after grouping
For responses submitted while people belong to session groups, the All responses dropdown can filter to one group or show Segment by group. Segmentation displays up to four group panels together, with Next groups and Previous groups for additional groups. Responses without group membership appear in an Ungrouped panel when group results are present. Return to All responses for the whole collection.
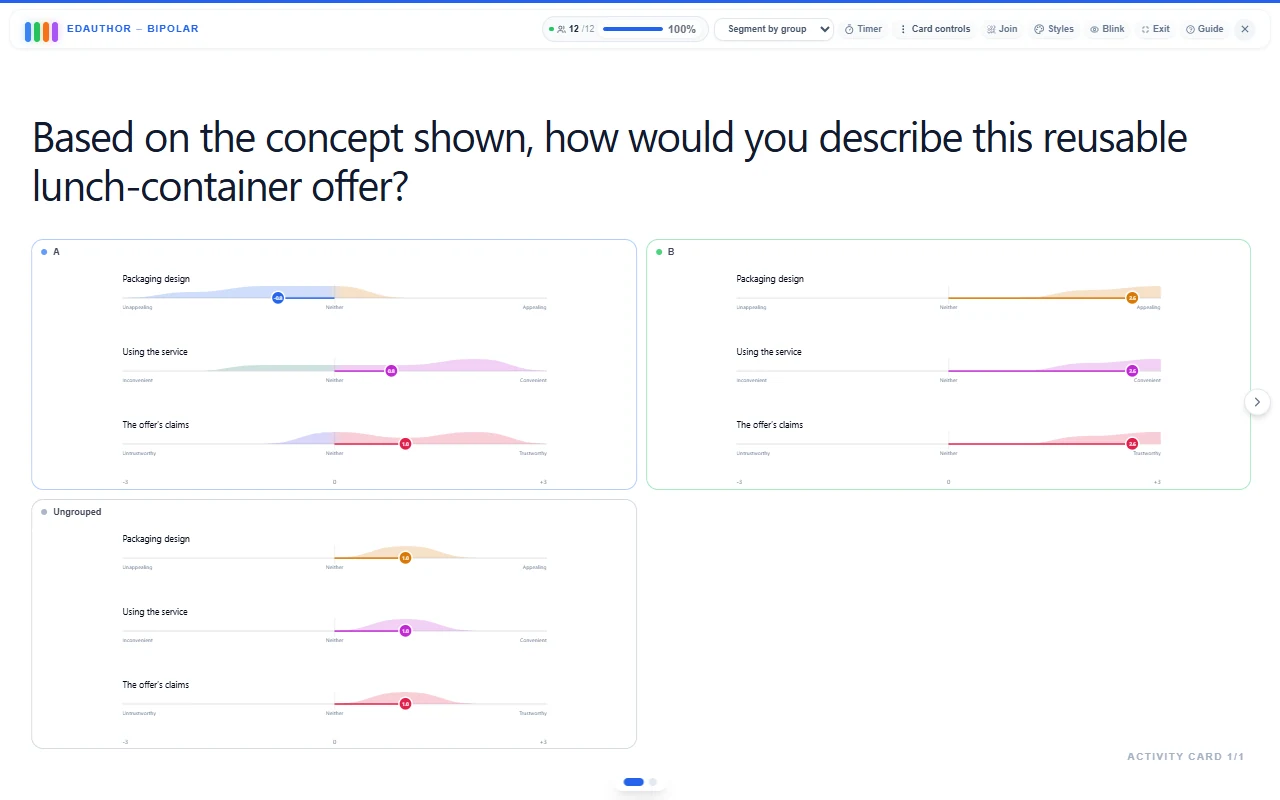
A response retains the membership recorded at submission. Creating groups afterwards does not reclassify the original answers. Use a second, distinct card to collect responses with the new membership and preserve the first collection. Compare the two displays manually; this workflow does not automatically measure individual change.
A 25-minute consumer-perception workshop
This suggested activity explores a fictional reusable lunch-container concept. Show everyone the same concept description: a durable, washable container with a returnable deposit, supplied through a campus café. Add your own clearly labelled concept image if it helps.
Prepare two separate Bipolar cards with the same prompt:
Based on the concept shown, how would you describe this reusable lunch-container offer?
Use Endpoint value 3 and Individual labels:
- Packaging design: Unappealing / Neither / Appealing
- Using the service: Inconvenient / Neither / Convenient
- The offer’s claims: Untrustworthy / Neither / Trustworthy
These original example items form a discussion profile. They do not constitute a validated composite attitude scale.
| Stage | Time | Facilitator action | Card or tool | Purpose |
|---|---|---|---|---|
| Introduce the concept | 3 minutes | Present the same description and explain the endpoints, centre and Skip | Media & Text or shared briefing | Establish a common basis for judgement |
| Rate independently | 3 minutes | Each participant reviews all three items and submits | First Bipolar card | Collect initial perceptions |
| Form discussion groups | 2 minutes | Select Packaging design, check sizes and deal with unassigned participants | Use card results | Connect a response to a shared task |
| Explain and investigate | 7 minutes | Ask what shaped the rating and what evidence is missing | Group discussion | Explore reasons and assumptions |
| Rate again | 3 minutes | Each person answers the same items on the second card | Second Bipolar card | Preserve a fresh collection with group membership |
| Compare and reflect | 7 minutes | Explore group views, revisit the first display and collect an explanation | Bipolar and Thought Bubble | Identify differences and a next research question |
Give the groups the same task: “Which detail most influenced your impression? What would you change? What would you need to see or try before making a firmer judgement?” Explain this aloud or on a shared Presentation Slide.
Compare how the groups rate convenience and credibility, not just the packaging item that created them. Differences on the grouping item are partly built into the allocation. They are not independent evidence that two natural consumer segments exist.
Close with Thought Bubble: “Which piece of evidence would most change your view, and why?” A small workshop can generate useful questions for further investigation; it does not establish population preferences or purchase behaviour.
Frequently asked questions
Is Bipolar a semantic differential scale?
Bipolar supports semantic differential questions when you use appropriate opposing descriptors. It also supports other two-sided judgements. The wording and research design determine what the responses mean.
How many scale points and items can I use?
Endpoint value runs from 1 to 20, creating a symmetric integer range around zero. A value of 3 creates seven positions, while the default 10 creates 21. A card supports one to eight items, each with up to 250 characters in its prompt.
Can each item have different endpoint labels?
Yes. Choose Individual labels and set each item’s left, centre and right labels. Choose Shared labels when all items should use the same descriptions.
What happens to neutral and skipped responses when creating groups?
Both stay unassigned, along with unanswered items and late arrivals. Negative responses to the selected item join one group and positive responses join the other. Review the preview and help unassigned participants join appropriately.
Can anonymous responses form groups?
No. Answer-based allocation needs non-anonymous responses in a live main room. Anonymous responses can still be displayed and contribute to summaries of existing groups.
Give perceptions somewhere to go
Choose a clear pair of meanings, make the response distribution visible and ask what shaped it. Use the answer-based split when it serves a useful discussion, then carry those groups into the next activity.
Explore Scale for Likert-style ratings, Multiple Choice for groups formed from choices, or the full Activity Card manual.