Read the rating and the room
Scale is edauthor’s Activity Card for collecting numeric ratings across one or more items. Set a shared response range, label its endpoints and ask participants to rate up to eight statements or tasks. Live results show an average for each item alongside the distribution of responses. You can allow individual items to be skipped, reveal results after thinking time and compare existing session groups. Use the ratings to decide what to ask, explain or explore next.
This guide is for lecturers, consumer researchers and workshop facilitators, with ideas for teaching, customer feedback and service design. Scale can help you explore confidence, agreement, perceived usefulness or readiness. Each needs a clear question: a rating only becomes useful when people understand what the numbers mean.
Choose what you want to understand
Start with the discussion you want the ratings to open. A question about confidence might help you choose which example to revisit. Agreement with a statement might lead into a debate. Feedback on parts of a workshop might help learners explain what they found useful.
| Purpose | Question or item example | Shared endpoint labels |
|---|---|---|
| Confidence before practice | How confident do you feel about choosing a research question? | 1 = Not yet confident; 5 = Very confident |
| Agreement with statements | A pilot study should take place before a full rollout. | 1 = Strongly disagree; 5 = Strongly agree |
| Feedback on a learning session | How useful were the worked example, pair discussion and reflection? | 1 = Not useful; 5 = Very useful |
Keep each item focused on one thing. “Choosing a method and explaining its limitations” can be difficult to rate if someone feels differently about the two tasks. Separate them into items, and use the same meaning for the range throughout that card.
For confidence questions, the response is a participant’s judgement of their confidence. Follow it with an explanation or a task when you also want evidence of understanding.
Likert-style ratings and multiple-item scales
For agreement with statements, Scale supports Likert-style ratings. Set a range such as 1 to 5 and use Strongly disagree and Strongly agree as the endpoints. Explain the intermediate meanings in your instructions, for example 2 = Disagree, 3 = Neither agree nor disagree and 4 = Agree. The card displays numeric sliders with endpoint labels; it does not automatically label every position with a response category.
The terminology matters. One agreement statement is a Likert-type item. A Likert scale usually combines several related items to measure an underlying concept. Confidence, importance and usefulness ratings are other applications of the Scale card; they are not automatically Likert scales. Sullivan and Artino (2013) explain the interpretation of individual items and collections of related items.
Why ask several questions? An attitude such as confidence in a service or overall favourability towards a product can be difficult to capture in one sentence. Related items let you explore the concept from more than one angle. Multiple-item measurement still needs careful design, pre-testing and evidence of reliability and validity. Boateng and colleagues’ scale-development primer describes these steps.
edauthor shows the average and distribution for each item separately. These are averages across participants, not an automatically calculated total attitude score for each person. The card does not establish that your items form a valid scale or perform reliability analysis. Combine items only with a justified scoring method, consistent coding and an explicit approach to missing answers. Different dimensions, such as price, convenience and trust, can be useful together as a profile without being interchangeable parts of one score.
A consumer-behaviour example
Imagine a facilitated study of a proposed reusable lunch container. Show everyone the same concept description or image using Media & Text, then ask how far they agree with these original example statements:
- Using this reusable container would be a good idea.
- I find the idea of using this container appealing.
- My overall impression of using this container is favourable.
Use a shared 1-to-5 agreement range. These statements offer a starting point for exploring overall attitude, not a validated questionnaire. Examine their distributions separately, then ask: “Which detail shaped your view? Was any statement difficult to interpret?” A Thought Bubble can collect those explanations.
On a separate card, explore practical beliefs: “The return process seems convenient” or “The deposit seems affordable”. Keeping these questions distinct helps you discuss possible reasons behind an attitude. A favourable rating does not establish purchase intention or actual purchasing behaviour. If either matters, ask or observe it separately through an appropriate study design.
For brand research, organise questions by the concept they address: recognition and recall, overall attitude, perceived quality, or loyalty intentions. Recognising a brand is different from trusting it or intending to buy it. Separate cards can keep these dimensions clear. If an established questionnaire includes reverse-worded items, follow its scoring instructions consistently; edauthor does not automatically reverse-code or combine your ratings.
The same workflow can be adapted to other settings:
| Setting | Example item | Useful follow-up |
|---|---|---|
| Consumer concept testing | The proposed service fits my daily routine | Which part would make it easier or harder to use? |
| Customer experience | The explanation of charges was clear | Which charge needs a better explanation? |
| User research | I felt confident completing this task | Where did you hesitate? |
| Professional development | I feel ready to apply this process | What further practice would help? |
These are suggestions for live sessions, exploratory studies and question pilots. Match your sample and analysis to the research question before drawing wider conclusions. For international audiences, pre-test translated statements and response meanings with the people you intend to include.
When to choose Bipolar instead
For perceptions between opposite descriptors, such as Unappealing and Appealing or Confusing and Clear, use the dedicated Bipolar card for semantic differential scales. It has a symmetric range centred on zero, a visibly two-sided control and shared or individual left, centre and right labels. Scale uses a shared lower-to-higher range. Choose the card whose wording and response design fit your question.
Build your first Scale card
- Add the activity. Open your Activity Cards in the editor, select Add Activity, then Scale.
- Write the question. Add a title and a Question / Prompt, such as “How confident do you feel about each research task?”
- Set the Response range. Enter the Lower and Higher numbers. The starting range is 1 to 10; for this guide’s example, use 1 to 5. Choose whole numbers, with the higher number greater than the lower one.
- Explain the endpoints. Set Lower label to “Not yet confident” and Higher label to “Very confident”. These labels and the numeric range apply to every item on the card.
- Add your Items. Enter “Choosing a research question”, “Selecting a suitable method” and “Explaining a limitation”. Use Add scale item for each additional item. You can reorder items with the drag handles, delete them while retaining at least one, or paste one item per line. The editor supports up to eight items, with up to 250 characters per item.
- Decide whether skipping is useful. Allow participants to skip individual scale items is on by default. Keep it on when someone may reasonably lack enough information or experience to rate an item.
- Choose visibility and attribution. Keep Show responses live on to display incoming answers, or untick it and reveal them later from Card controls. Anonymous hides participant names in responses and results.
- Preview and save. Check the question, endpoints and item order, then save your Activity Cards and include the card in your session. Use Additional Instructions (optional) if learners need more guidance on interpreting the range.
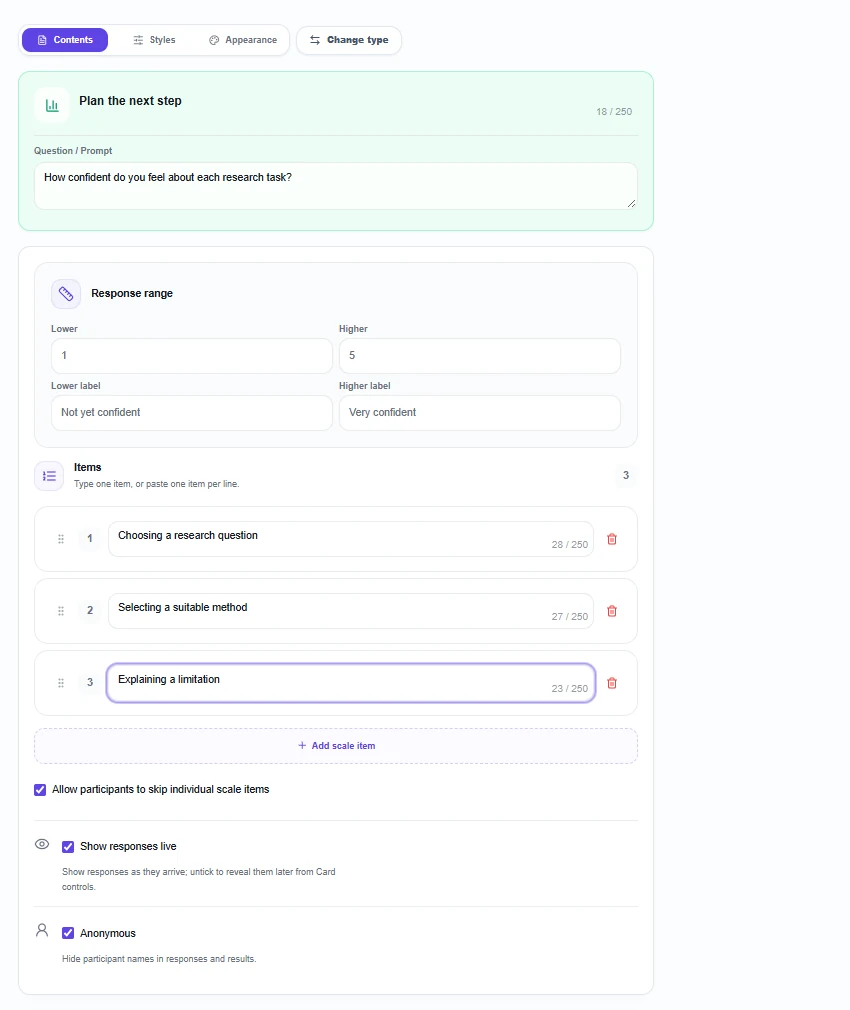
Use a short set of items when the purpose is a quick discussion. Eight is the editor limit, not a target. Finalise the range, wording and order before collecting responses so everyone answers the same question.
What participants see and submit
Participants join through the session’s QR code, joining link or session code without needing an edauthor account. When the Scale card is active and accepting responses, they see each item with a slider, its current number and your endpoint labels. They set their ratings, then press Submit once for the card.
Each slider starts at the lower value. An untouched slider can be submitted at that value. Ask participants to review every item before submitting, and to use Skip where appropriate. Moving a control is not a requirement for submission, so a low rating alone does not tell you whether someone actively changed the slider.
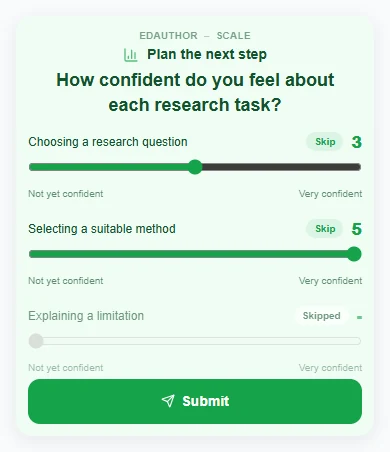
Selecting Skip disables that item’s slider and shows Skipped. Selecting it again brings the rating back. A skipped item contributes no value to its average; it is neither a zero nor a middle response. Participants can skip every item when skipping is enabled.
These remain individual responses when learners are in groups. You can invite discussion first and then ask everyone to rate independently. The displayed group result summarises those submissions rather than a single agreed group answer.
See the average and explore the spread
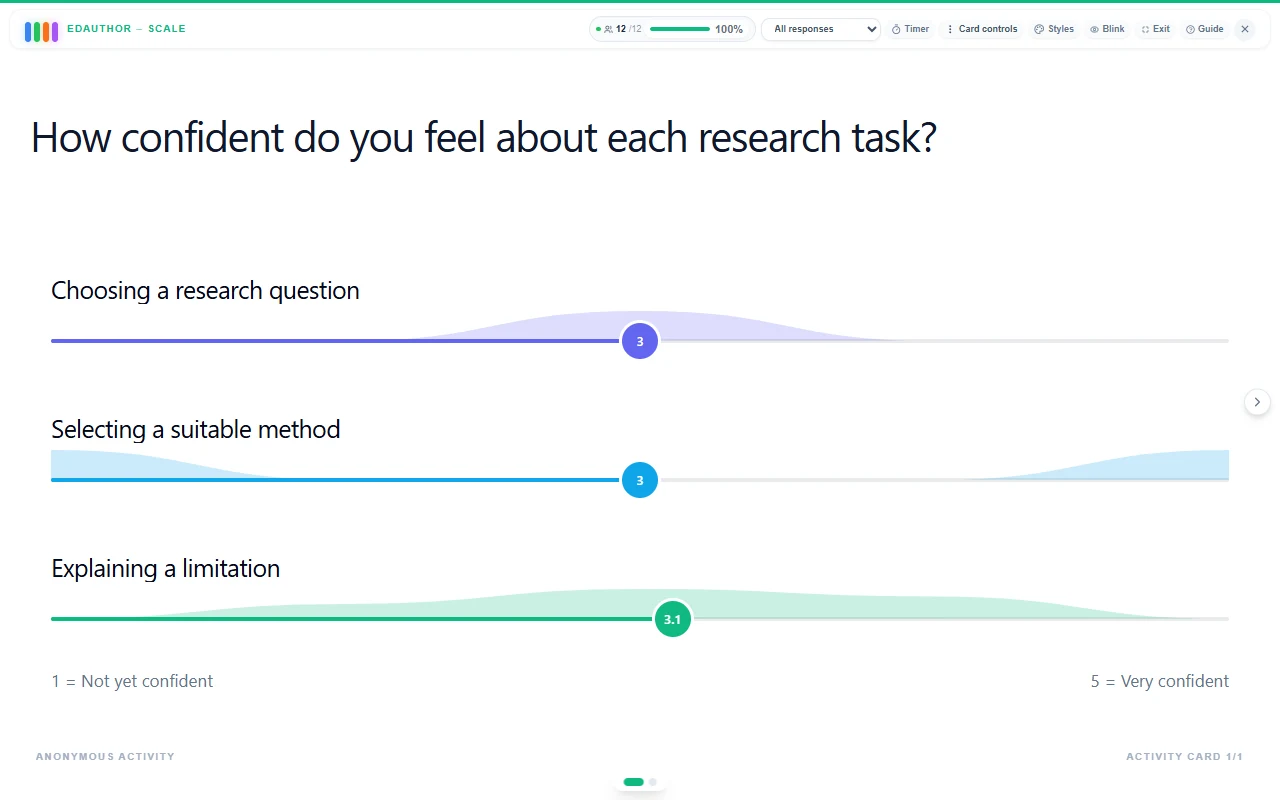
Each results row has an item label, a coloured average marker and a shaded distribution. The marker shows the arithmetic mean of the numeric ratings submitted for that item, displayed to at most one decimal place. An item with no usable ratings has no average marker.
The shaded shape shows where ratings cluster. In the example at the top of this guide, the first two items both average 3. For the first item, all twelve example ratings are 3. For the second, six are 1 and six are 5. The average is identical, but the second pattern invites a different question: what experiences or interpretations lie behind the two ends?
On the host screen, hover over a row to see counts at the selected rating values. The distribution’s height is scaled within each item, so compare the shape for spread and use the counts for numbers of responses. A taller-looking peak in one row does not establish that more people answered that item.

Skipped items also matter. The example’s third item has nine numeric ratings and three skips, so its average of 3.1 is calculated from nine ratings. A card’s submission total does not mean every item received that many ratings. Check the counts before treating small differences as meaningful.
For independent thinking, collect ratings with Show responses live unticked. Open Card controls to reveal them when you are ready, then ask learners what they notice. Hiding the display keeps the recorded responses; it does not clear the activity.
Compare existing session groups
If learners belong to session groups, the All responses dropdown lets you select a particular group or choose Segment by group. Selecting one group shows its ratings on the main chart; selecting All responses returns to the whole collection.
Segment by group displays separate group panels, with up to four panels visible together. For more groups, use Next groups and Previous groups. The average and distribution inside each panel are calculated from that group’s responses, including the same handling of skipped items.
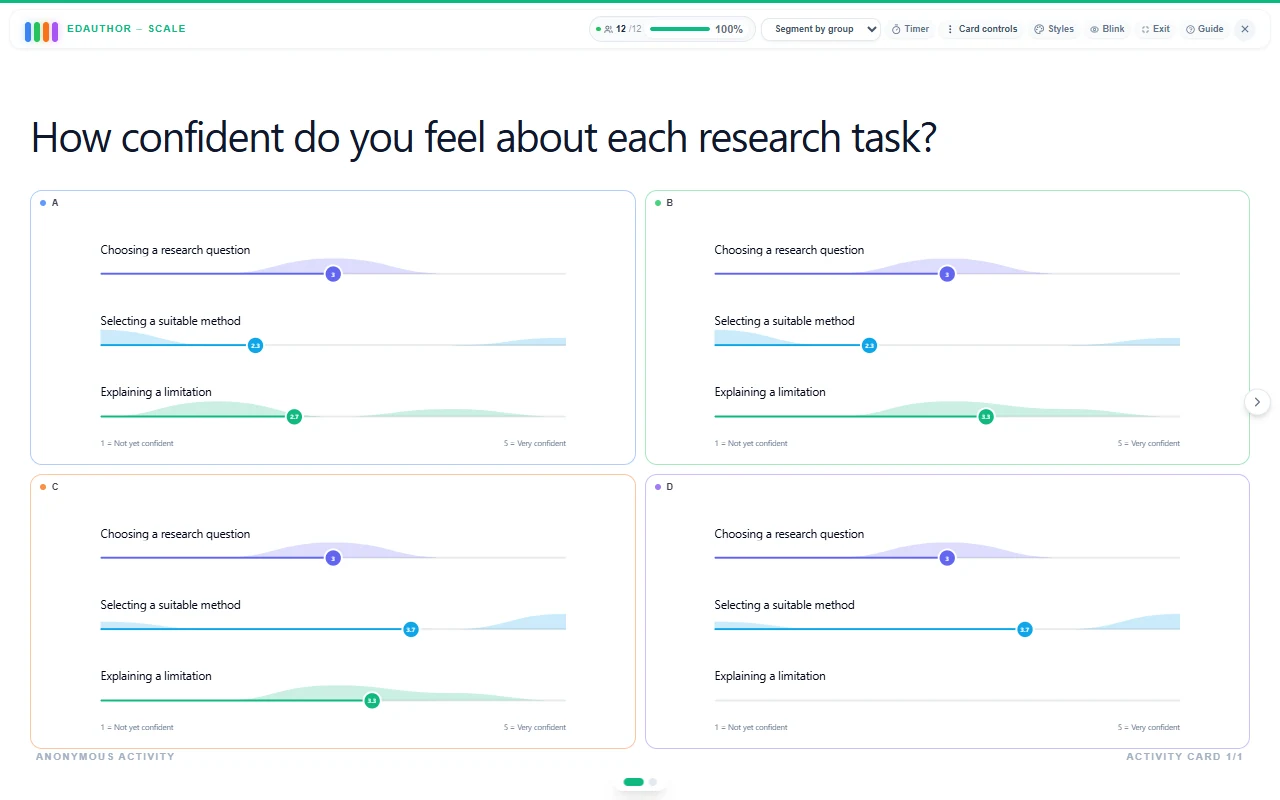
Membership is recorded when a response is submitted. Moving someone afterwards does not rewrite the group attached to their earlier answer. Establish the groups before the activity if group comparison is part of your plan.
Scale displays results for existing groups. To create groups from answers to an activity, use the supported Multiple Choice workflow or explore the group-learning guide. Scale ratings themselves do not provide Use card results allocation.
Anonymous responses can still contribute to group summaries, while individual attribution is hidden. In small groups, keep the discussion focused on the pattern and invite voluntary explanations rather than asking people to identify a particular response.
A 20-minute research-planning activity
This suggested seminar activity connects a confidence rating with an opportunity to practise. The screenshots illustrate its opening question and example responses.
Prepare two separate Scale cards with the same question, range, labels and three items:
How confident do you feel about each research task?
- Choosing a research question
- Selecting a suitable method
- Explaining a limitation
Use 1 = Not yet confident and 5 = Very confident. Keep skipping available. If you want group comparisons, form the groups before the first card and keep membership consistent. Explain that the ratings describe confidence, not a test score.
| Stage | Time | Facilitator action | Card or tool | Discussion purpose |
|---|---|---|---|---|
| Set the task | 3 minutes | Explain the items, endpoints and how to skip | Shared briefing | Establish a common interpretation |
| Rate independently | 3 minutes | Ask everyone to review each slider and submit | First Scale card | Surface starting confidence |
| Practise in pairs | 6 minutes | Ask pairs to outline a small study of how students choose study spaces | Spoken or written planning | Apply the three research tasks |
| Explore the reasoning | 4 minutes | Invite examples of questions, methods and limitations | Shared discussion | Make choices and uncertainties explicit |
| Rate again | 2 minutes | Collect fresh ratings using the same wording | Second Scale card | Revisit confidence after practice |
| Name a next step | 2 minutes | Ask what would help learners progress | Thought Bubble | Turn reflection into a concrete request |
Give pairs three prompts: “What focused research question would you ask? How would you collect evidence to answer it? What is one limitation of that approach?” Share them aloud or on a Presentation Slide.
When reviewing the ratings, ask: “Which item has the widest spread? What might help someone who is less confident? Has the task made any part seem more complex than you first thought?” A lower second rating can be an opening for reflection rather than a disappointing result.
Keep both Scale cards. Compare their displays manually, using the same group view where appropriate. This workflow preserves the first collection; it does not automatically calculate individual change or establish that learning improved.
Finish with Thought Bubble: “What is one thing you need to clarify before planning your own small study?” The written explanation can help you decide what to address next.
Frequently asked questions
How many items can a Scale card contain?
One to eight. Each item can contain up to 250 characters, and all items share the card’s numeric range and endpoint labels.
Can I use a 1-to-5 agreement scale?
Yes. Set Lower to 1 and Higher to 5, then use endpoint labels such as Strongly disagree and Strongly agree. Write statements that can be interpreted consistently and discuss the distribution alongside the average.
What happens to skipped items?
They contribute no numeric value to that item’s average or distribution. Different items can therefore have different numbers of ratings, even though participants submit the card once.
Do participants have to move every slider?
No. Sliders begin at the lower value and unchanged values can be submitted. Ask participants to review each item and use Skip for items they cannot meaningfully rate, when that option is enabled.
Can I show several groups at the same time?
Yes. Choose Segment by group in the results dropdown. Up to four group panels appear together, with page controls for additional groups. You can also filter to one group or return to All responses.
Make the next question count
Choose a clear range, name what you want learners to rate and look beyond the average. Use the distribution and group views to invite explanation, then connect the ratings to a useful example, discussion or next step.
Explore the Activity Card manual to connect Scale with other activities in your session.