Rate what matters, then explore why
Slider is edauthor’s Activity Card for collecting individual numeric ratings across up to twelve items. Participants move horizontal sliders within your shared range, then submit their answers together. The host sees a vertical column for each item, showing its average and response distribution. You can allow items to be skipped, switch the results direction and compare existing session groups. Use it to explore priorities, confidence, usefulness or service experiences, then follow the numbers with a discussion.
For lecturers, trainers, consumer researchers and workshop facilitators, the useful question is often: where should we focus our attention? A set of ratings can give the room a common starting point. The distribution helps you see whether a similar average hides different experiences.
When Slider is useful
Choose one meaning for the shared range. You might ask how important several features are, how confident participants feel about several tasks, or how useful different parts of a session were. Keep the items specific enough to discuss afterwards.
| Context | Example question | Useful next step |
|---|---|---|
| Consumer and service research | How important is each feature when choosing a collection service? | Ask which situation makes a feature matter |
| University teaching | How confident do you feel about each stage of analysing a dataset? | Work through the stage that needs clarification |
| Workshop planning | How useful would each proposed topic be for your work? | Ask what participants need to do differently |
| User research | How easy was each task in the prototype? | Investigate the steps where people hesitated |
| Team reflection | How clear is each part of our project brief? | Rewrite the least clear instructions together |
These are suggested applications. A confidence rating is someone’s judgement of confidence, not a test of competence. A high importance rating does not show what someone will buy. Pair the rating with the evidence or explanation your decision needs.
Slider rates each item independently. Participants can give every feature a high value. There is no shared points budget and the card does not require a ranking. For priorities under a constraint, discuss the constraint explicitly: “If we could improve only one feature this month, which would you choose, and why?”
Slider, Scale or Bipolar?
edauthor provides different ways to present rating activities. Choose the wording and visual display that suit the conversation.
| Card | What it offers | A useful fit |
|---|---|---|
| Slider | Up to twelve items, a shared numeric range, vertical results columns and a choice of results direction | Comparing several feature ratings or workshop priorities |
| Scale | Up to eight items with a shared range and horizontal results rows | Confidence, usefulness and Likert-style agreement statements |
| Bipolar | Up to eight items on a symmetric range around zero, with shared or individual opposing labels | Semantic differential questions such as Confusing to Clear |
Slider and Scale both use horizontal controls on participants’ devices. Slider’s distinctive view is on the host screen: coloured columns place the items next to one another, with averages and distributions on a common vertical range.
If you are measuring agreement with related statements, the Scale guide explains Likert-style items and multiple-item measurement. For opposing descriptions and groups created from answers, see the Bipolar guide. A collection of ratings does not automatically constitute a validated research instrument or a combined score.
Build your first Slider card
- Add the activity. In the Activity Cards editor, select Add Activity, then Slider.
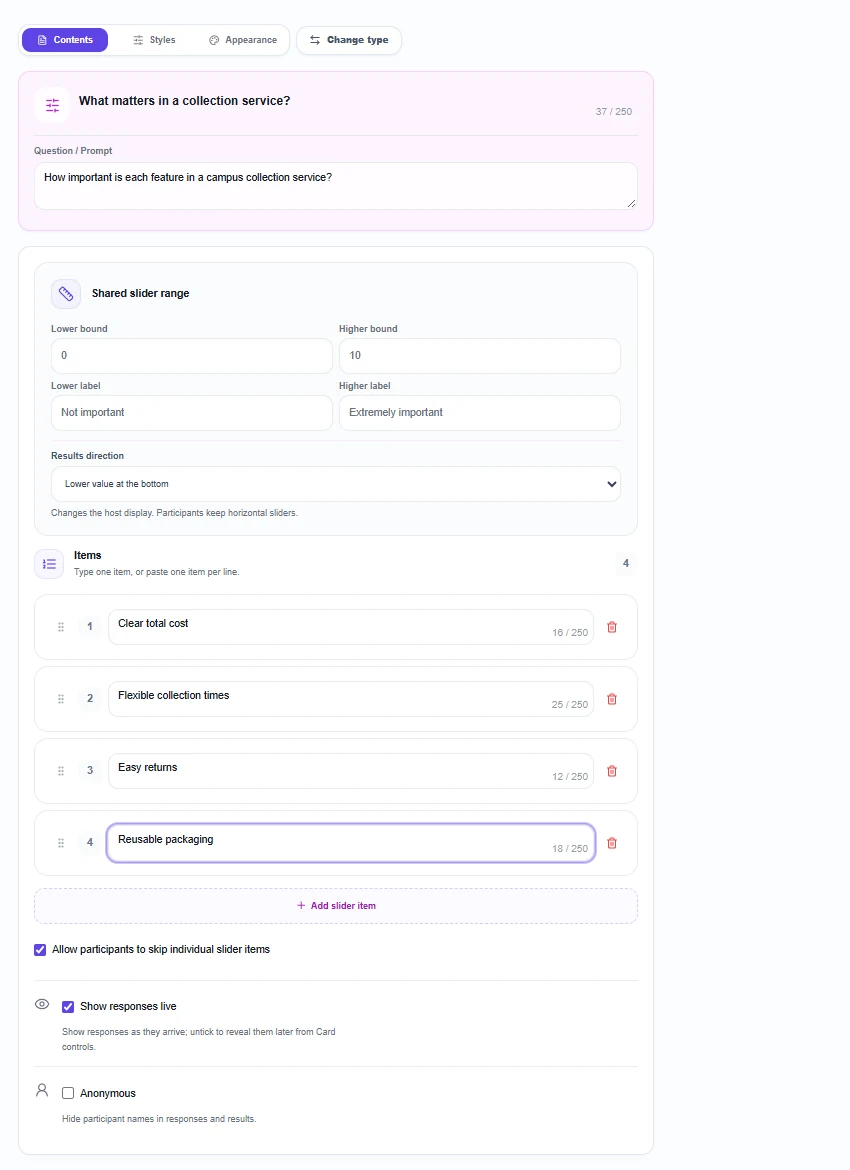
- Write the question. Add a title and a Question / Prompt. For the example in this guide, use “How important is each feature in a campus collection service?”
- Set the Shared slider range. Enter the Lower bound and Higher bound. The starting range is 0 to 10. Use whole numbers, with the higher bound greater than the lower bound. Participants select values in steps of one.
- Explain the endpoints. Set Lower label to “Not important” and Higher label to “Extremely important”. The numbers and labels apply to every item on this card.
- Choose the Results direction. Lower value at the bottom is the default. Lower value at the top reverses the host display. Participants keep their horizontal sliders.
- Add the Items. Enter “Clear total cost”, “Flexible collection times”, “Easy returns” and “Reusable packaging”. Use Add slider item for more items. You can reorder them with the drag handles, remove them while retaining at least one, or paste one item per line. There is a limit of twelve items and 250 characters per item.
- Choose skipping and visibility. Allow participants to skip individual slider items is on by default. Show responses live determines whether incoming responses appear straight away. Anonymous hides individual attribution.
- Preview and save. Check the wording, range and order, then save your Activity Cards and include the card in your session. Use Additional Instructions (optional) to explain the service or what the numbers mean.
Use the number of items your discussion needs. Twelve is the maximum, not a target. “Fast and environmentally responsible delivery” combines two ideas that someone might rate differently; separate them. Finalise your items before collecting answers.
What participants see and submit
Participants join through a session QR code, link or code without needing an edauthor account. When Slider is active and accepting responses, they see one horizontal slider per item, your endpoint labels and the currently selected number. Each person reviews the items and selects Submit once for the card.
The initial value is zero if zero falls within the range; otherwise it is the lower bound. With 0 to 10, every slider begins at zero. With 1 to 5, every slider begins at one. Unchanged values can be submitted, so ask participants to review each item deliberately.
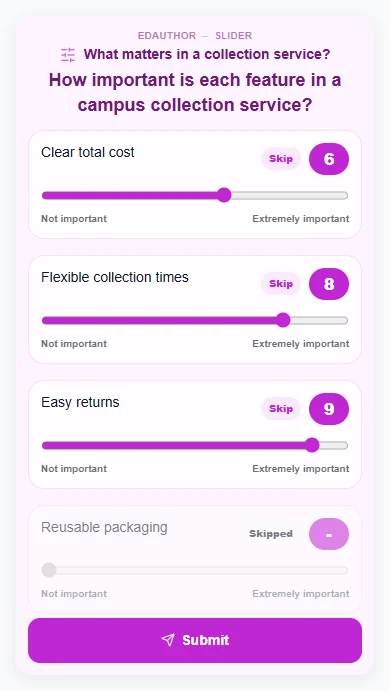
If skipping is enabled, selecting Skip disables that item’s slider and changes the button to Skipped. Select it again to restore the rating. A skipped item contributes no numeric value to its average or distribution. Participants can skip all items if they cannot meaningfully answer them.
These are individual submissions, including when participants belong to groups. You can ask people to discuss first and then each respond, but the group display summarises individual ratings. It does not mean that everyone agreed on one answer.
Read the columns and the distribution
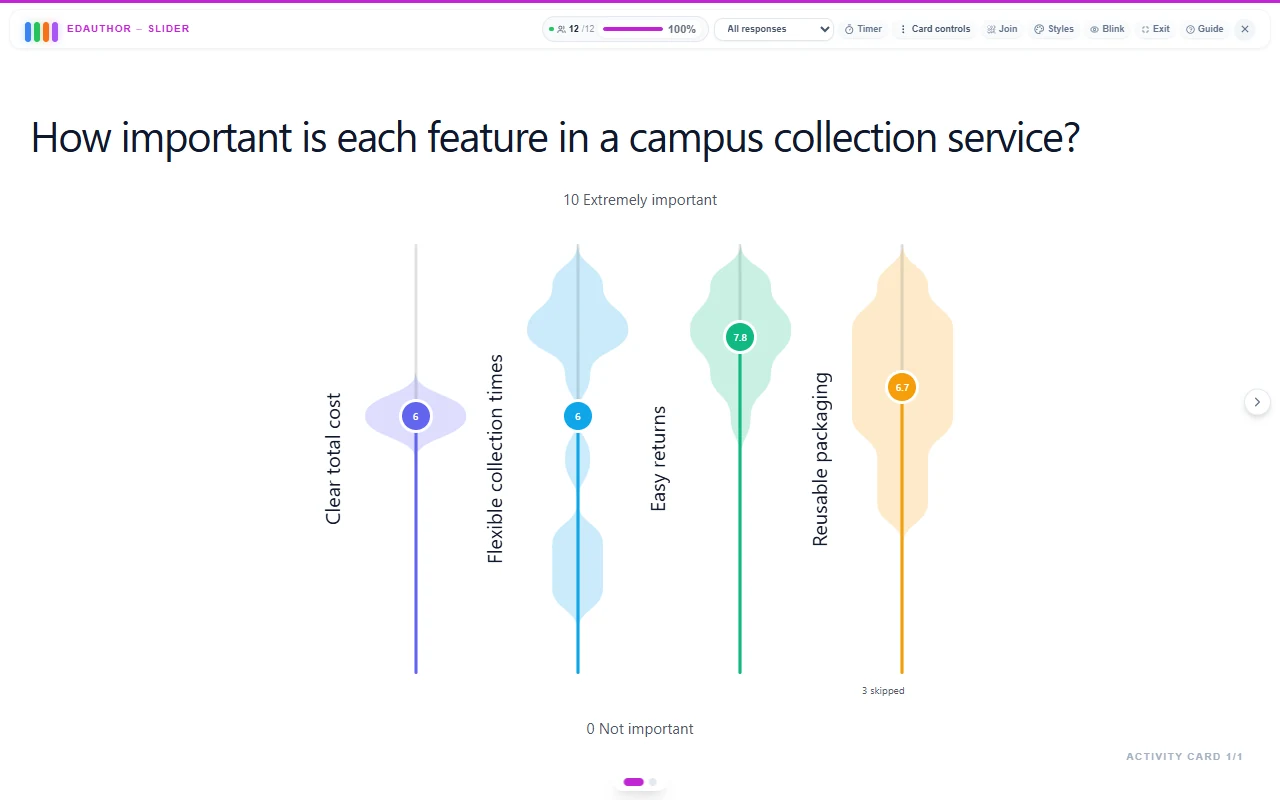
Each item has a coloured column with an average marker and a shaded shape showing the distribution of ratings. The average is the arithmetic mean of the numeric responses to that item, displayed to at most one decimal place. An item without numeric responses has no average marker.
In the example, Clear total cost has twelve ratings of 6. Flexible collection times also averages 6, but its responses are spread across 2, 3, 5, 7, 8 and 9. Ask what circumstances make collection times more important for some people. The shared average is a starting point, not a complete description.
Hover over a column, or focus it with the keyboard, to reveal response counts. The mirrored sides belong to the same distribution; they are not two groups. Shape width is scaled within each item, so use the counts when comparing response numbers across items.
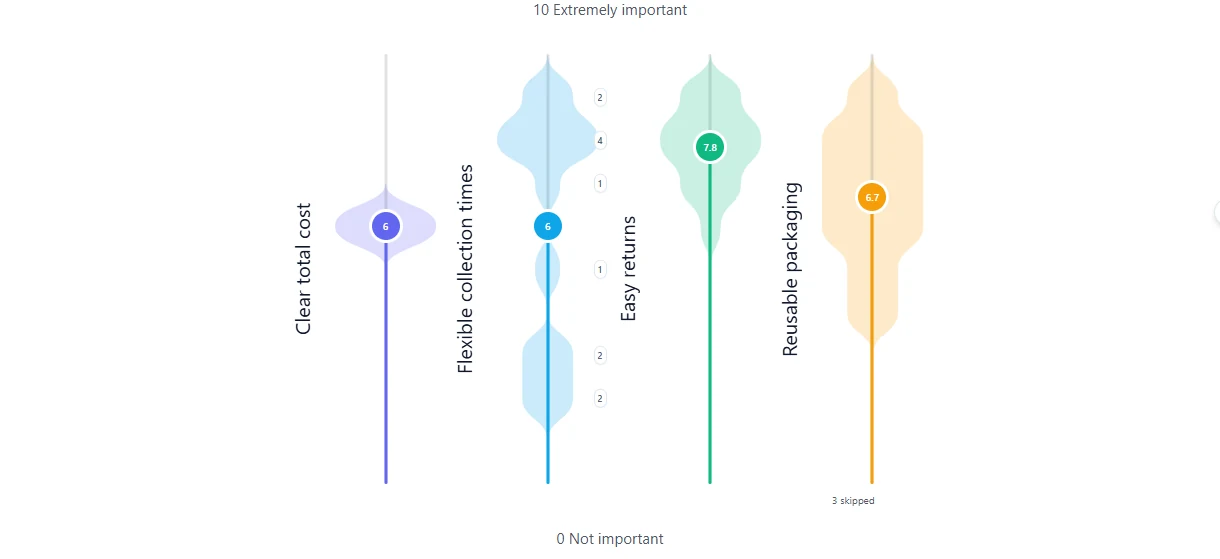
For whole-number ranges spanning up to 40, each selectable value has its own count. Wider ranges are grouped into 21 positions for the distribution display. A count on a wider-range chart can therefore represent several nearby values. The average still uses the submitted numeric ratings.
Skipped items appear below their column. In the example, Reusable packaging has three skips and nine numeric ratings, averaging 6.7. The card’s twelve submissions do not mean every item has twelve ratings. Check skips and response counts before interpreting small differences.
On narrower host displays, the chart shows items in pages. Use Next slider items and Previous slider items, with the visible item range shown between them. Paging changes which columns are visible; it does not remove the other items or their answers.
Change the view while facilitating
You can set Results direction in the editor or change it in the host’s Styles panel during presentation. Choose Lower value at the bottom for a familiar upward-growing display, or Lower value at the top when that better fits how you want to read the values.
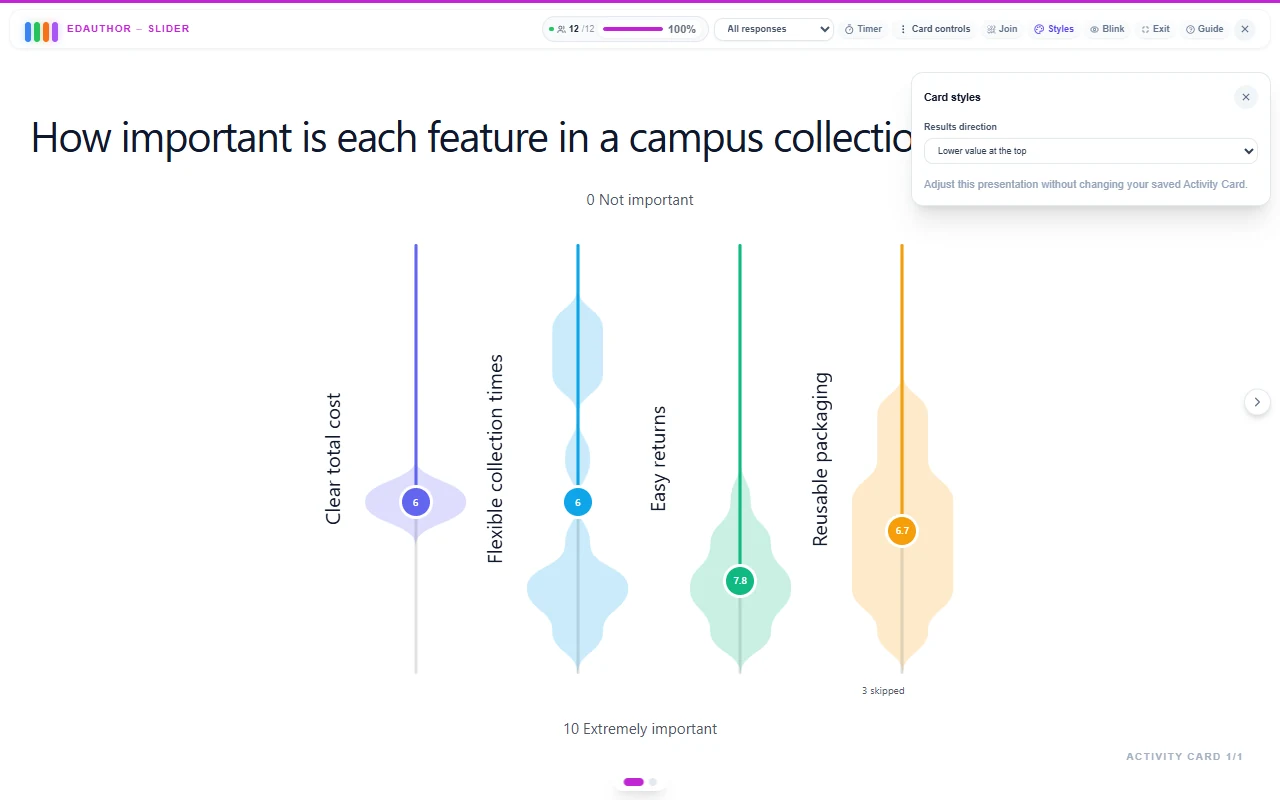
The live choice changes the presentation, not the recorded answers or their numeric meaning. Use the editor setting to save the starting direction with the card. A live Styles change is a presentation override, rather than an edit to the saved card configuration.
For independent initial ratings, untick Show responses live before collecting them. Reveal the display later through Card controls. You can give people thinking time, then use the visible results to open discussion without clearing the collection.
Compare existing groups
When responses have session group membership, use the All responses dropdown to select one group or choose Segment by group. The segmented view shows up to four group panels together; use Next groups and Previous groups for more. Each panel calculates its own averages and distributions. Return to All responses for the whole collection.
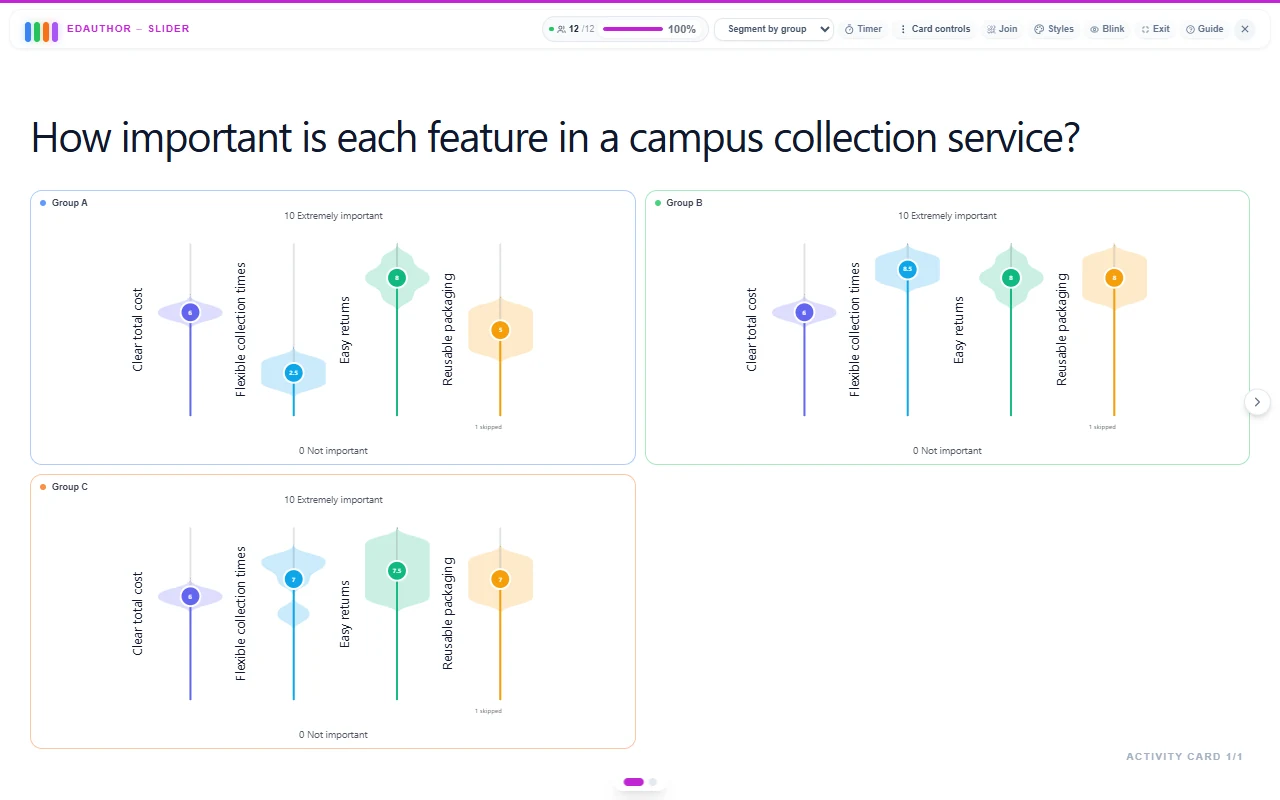
Establish groups before collecting ratings when you want this comparison. Membership is recorded with each submission; moving someone afterwards does not reclassify their earlier response. Anonymous answers can still contribute to group summaries, while individual attribution remains hidden.
Slider compares existing groups. To form groups from answers, use Bipolar or Multiple Choice, then continue with Slider. Slider itself does not offer Use card results allocation.
Check how many people answered each item before discussing group differences. Invite explanations voluntarily, especially in small groups. A group average does not represent unanimous agreement or establish a wider population finding.
A 20-minute service-design workshop
This suggested activity explores a fictional campus service for collecting and returning online orders. It can be adapted for a consumer-behaviour seminar, a customer workshop or a team planning session.
Prepare two separate Slider cards with the question and four items used above. Keep the 0-to-10 range, endpoint meanings and item order identical. If you want group comparisons, establish the groups beforehand and keep membership consistent.
| Stage | Time | Facilitator action | Card or tool | Purpose |
|---|---|---|---|---|
| Brief the room | 3 minutes | Describe the service and explain the range and Skip | Media & Text or shared briefing | Give everyone the same starting information |
| Rate independently | 3 minutes | Ask each person to review four features and submit | First Slider card | Collect initial importance ratings |
| Explore priorities | 6 minutes | Discuss one feature to improve first and why | Small-group discussion | Make assumptions and trade-offs explicit |
| Rate again | 2 minutes | Each person answers the same items on the second card | Second Slider card | Preserve a fresh collection after discussion |
| Compare and reflect | 6 minutes | Compare the displays and ask what shaped the answers | Slider and Thought Bubble | Identify reasons and a useful next question |
Share these discussion prompts aloud or on a Presentation Slide: “Which feature would you improve first if only one change were possible? Whose circumstances might lead to a different priority? What information would help you decide?”
Compare the two Slider displays manually, using the same group view if appropriate. Keep both cards to preserve the first answers. This workflow does not automatically calculate individual change or establish that the discussion caused a change.
Close with Thought Bubble: “What is one reason behind your rating that the number alone cannot show?” For a real service decision, use these explanations to plan the next investigation rather than treating a workshop as a representative consumer survey.
Frequently asked questions
How many items can Slider contain?
One to twelve, with up to 250 characters per item. All items share the same numeric range and endpoint labels. Narrower results displays show the columns in pages.
Can I use 1 to 5 or 0 to 100?
Yes. Set whole-number Lower bound and Higher bound values, with the higher one greater than the lower one. Participants move in steps of one. Wider ranges are grouped for the distribution display, while averages use the submitted numbers.
Does reversing the results direction change participants’ answers?
No. Results direction changes the host display. Participants retain horizontal sliders, and the values, averages and recorded responses stay the same.
What happens if a participant leaves a slider untouched?
Its starting value can be submitted: zero when the range includes zero, otherwise the lower bound. Ask participants to check every item and use Skip when appropriate and enabled.
Can Slider create groups or collect one answer per group?
Slider collects individual answers and displays results for existing groups. It does not provide answer-based group creation or a collective group submission mode. Use Bipolar or Multiple Choice for supported group allocation, then continue with a Slider activity.
Turn ratings into a useful next step
Name what you want people to rate, explain the range and give them time to respond. Look at the distribution as well as the average. Then ask for the experience, evidence or reasoning behind the number.
Explore the Activity Card manual to connect Slider with presentations, discussion and reflection.